High prices cut Italians' food consumption. Revenue grows in supermarkets and hypermarkets but quantities sold decline, an unmistakable sign of widespread price hikes forcing Italians to lighten their shopping carts.
The dramatic trend is illustrated in detail by XIII edition of the Immagino Observatory, conducted by GS1 Italy through analysis of label information from nearly 133,000 items with NielsenIQ data on sales and consumption.
Italians' consumption battered by high prices
‘Prices are rising and it begins to be clearly seen how they are also decreasing volumes, although in different ways across price ranges.
The lower impact on consumption reduction is found in high-end products in price, where buyers have better absorbed the increases, although they too are beginning to compress purchases.
Conversely low-end products have suffered a more significant volume compression', explains Marco Cuppini, the creator of the Immagino Observatory.
The Immagino metaproduct
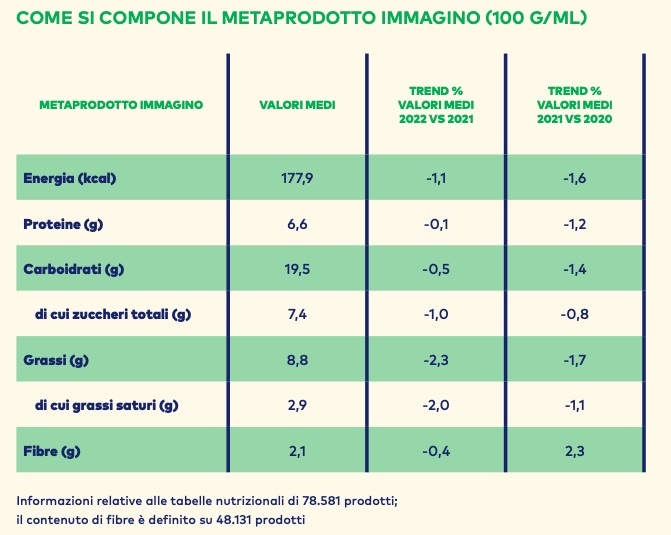
The nutritional composition of the basket of foods and drinks purchased in 2022 in hypermarkets and supermarkets, summarized in the Immagino metaproduct, indicates a reduction for all items, except proteins (6g, -0.1%) which remain essentially stable due to the great success of foods labeled as source of proteins (foods for athletes, semolina pasta, fresh desserts, cold cuts etc.).
Dietary fibers, subject of a (health) and lively interest in the recent past, also decline slightly. After +2.3% at the end of 2021, they decrease by -0.4% (settling at 2.1g in the metaproduct) in December 2022. The result is explained by lower consumption of products such as flours/mixes, frozen fruits and vegetables, dried legumes, wholemeal/farro/kamut/legume-based pasta, rusks, and the increased role of fibers in sports nutrition products, preserved legumes, semolina pasta, and ready first courses.
Sharp decline in the products ‘made in Italy‘
Sales of products with a label reference to Italian origin are experiencing a drastic drop in sales. The report reveals the impact of price increases. Compared to 2021, the sales value increased by +6.1% but volumes decreased by -5%.
Of the three marks distinctive on the label of made in Italy,
– the Italian flag – the first indicator by number of products (14,706) and turnover (over 6 billion euros) – loses ‘only’ -4%,
– ‘100% Italian’ drives sales value by +9.2% but volume collapses by -5%,
– ‘product made in Italy’ does worse. Value sales remained stable (+0.4% compared to 2021), while volumes fell by -7.1%.
Geographical Indications (GIs)
DOC and DOCG wines, dry charmat sparkling wine, classic method sparkling wine and mozzarellas are among the most affected products in the basket of 4,367 certified products. Stable sales value (+0.2%), but volumes decreased by -6.7%.
Same trend for the over 2,000 IGP and IGT products. In 2022 they gained a modest +1% in value (up to almost 631 million euros in sales), but lost 6% in volume.
Only Umbria, Molise and Sardinia do well
The reference to regional origin of food products corresponds to an increase in sales volume only in three regions:
– Molise (with the best sales value data, +24.8% and +5.9% in volume),
– Umbria (+10.5% in value, +3.9% in volume),
– Sardinia (+12.2% in value, +1.9% in volume).
First in ranking for turnover (€380 million generated by 983 products) is confirmed to be Trentino-Alto Adige, which however loses 5.4% of sales volume, particularly on DOC and DOCG wines, classic method sparkling wine and cold cuts.
Sicily, second in the ranking with a turnover of 364 million euros generated by 1,161 references, increases sales value (+3.1%), but loses -6.9% of sales volume.
Piedmont Displaces Emilia-Romagna from the podium and records a turnover exceeding 305 million euros (+4% compared to 2021), with a volume sales reduction of -3.4%. Mainly DOC wines and sparkling wines lose out charmat sweet and UHT milk
Free from, 17 out of 100. Sugars in the foreground
The products accompanied by a claim which boasts theabsence or reduced presence of an ingredient, nutrient or additive are now almost 17 out of 100. In 2022 they recorded a turnover of over 7.4 billion euros, +6%. Even in this case, however, overall volume sales decreased (-5.2%), with the exception of four claim.
The references on the label to the reduced sugar content still drove sales (in volume):
– ‘low sugar’, +4.1%,
– ‘no added sugars’, +1.5%.
The other two claim that increase volume sales are:
– ‘without antibiotics’. +4.3% in volume, +17.2% turnover of the 261 foods so labelled. Also in this case, information on risks related to antimicrobial resistance (and animal welfare) seems to begin to more strongly guide consumer choices,
– ‘without aspartame’, +2.2%, present on 64 products. The controversial synthetic sweetener was losing appeal in 2022, and will probably lose more after its inclusion among the substances classified by IARC as ‘possibly carcinogenic to humans’.
Free from, the three champions
On the podium, for turnover, the indications appear Free from:
– ‘without preservatives’. It claim accompanies 4,363 products for a turnover of 2.7 billion euros, +3.7%. Volumes, however, collapsed by -7.9%, especially on mozzarella, strained Greek yogurt, snacks, frozen savory specialties and mayonnaise. Between price increases and shrinkflation.
– ‘without palm oil’. It remains claim which certifies the elimination of cheap tropical fat from industrial food recipes. Appears on 2,806 products, accounting for nearly 1.7 billion euros in sales (+6.1%), though volume decreased (-6.9%). Poor performance for snacks, breakfast cereals, and traditional biscuits,
– 'low fat', claim present on 3 thousand products, does worse. Volume sales fall by -9.5%, while turnover grows by +5.9%. Consumers particularly give up strained Greek yogurt, cold cuts, mozzarella and snack sweets.
‘Rich in', protein and increasing micronutrients
Over 10 thousand products are accompanied by a claim which refers to the rich presence of a specific nutrient. The basket is worth 4.4 billion euros. As in almost all cases, turnover grows (+7.8%) while volume sales decrease (-3.6%) compared to 2021.
Among the 12 claim 'rich in' monitored by the Immagino Observatory, the reference to proteins stands out, present on 2,866 products generating a turnover of over 1.4 billion euros (+15%). In comparison, volumes sold remain stable (+0.1%), driven by the phenomenon of high-protein fresh desserts.
The success is not replicated in the other two claim on the podium:
– 'fiber' generates a turnover of over 1.2 billion euros (+5.3%) but loses volumes (-4.2%) due to price increases, especially for whole grain/multigrain biscuits, snack cakes and breakfast cereals.
– 'vitamins' is present on over 2 thousand products, whose turnover grew by 5.8% to over 1.1 billion euros. However, sales volumes fell significantly, -8.4% compared to 2021, especially on fruit-based drinks, UHT and fresh milk.
Magnesium, potassium and zinc
The micronutrients magnesium, potassium and zinc mentioned on the label drive sales of sports foods, functional yogurts, nuts.
Magnesium, highlighted on 431 products, increases turnover by 13.5%, while volume sales hold with +3.9%.
Potassium follows a trend analogous. It is recalled on the label of 246 products whose sales grow +7.7% in value (up to over 60 million euros) and +5.7% in volume.
Zinc, finally, in the basket marks the record growth in volume, +6.6%, and increases turnover by +11.6%, to over 50 million euros.
For the rest, among the rich intwo others deserve mention claim:
– ‘whole‘ records a moderate decline in volume sales of -3.1%, especially among snacks and whole biscuits. But the price increase boosted the turnover by +5.8%, up to over 868 million euros,
– 'lactic ferments' drops slightly in volume (-0.1%), highlighting an interest towards the halo of probiotics which resists increases, with turnover growing by a much stronger +8.2%, up to 386 million euros. Only functional yogurts lose market share.
Food intolerances, 'lactose-free' grows
The foods accompanied by claim targeted at those with food intolerance follow the trend observed so far: increase in value sales (+6%), decrease in volume sales.
The basket, however, shows overall a less marked contraction in volume sales (-3.3%).
The worst performance concern 'milk-free' and 'gluten-free' with AIC logo (Italian celiac association), which lose 7% of sales. The reason lies in high prices.
Only two positive cases among products labeled as allergen-free:
– ‘lactose-free‘ volume sales increase by +2.1% (+12.1% by value), thanks especially to fresh desserts, hard cheeses and similar, functional yogurt, UHT milk-based drinks and supplements.
– 'egg-free' records +5% value sales and maintains stable volume sales (+0.7%), thanks especially to fresh unfilled pasta, healthy biscuits and mayonnaise.
Veg and surroundings
In the three claim that indicate the absence of meat and/or animal-derived ingredients repeats the trend observed in other baskets due to the price increase.
Veg. It claim used for foods suitable for the vegan or vegetarian diet most important by turnover (2.1 billion euros, +3.6%) records a volume sales decrease of -8.9%. The worst results are for strained Greek yogurt skyr, mozzarellas, mayonnaise and tomato puree.
Vegetarian. The 2,041 products so labeled are worth over 1.4 billion euros (+4.6%), but volume sales fall considerably (-10.1%). Particularly poor are strained Greek yogurt skyr, mozzarellas, mayonnaise and extruded snacks.
Vegan. The basket worth one billion euros (+2% in 2022) loses -5.8% of volume sales, particularly on products that normally do not contain animal ingredients, such as tomato purees, extruded snacks, infusions (others), jams, as well as fruit-based spreads and snacks.
Kosher and halal
The two claim that indicate the suitability of a food to religious prescriptions have an opposite trend:
kosher. The turnover grew by 6.2% reaching nearly 824 million euros, but volumes sold decreased by -4%, more markedly on tomato purees, extra virgin olive oil and ground coffee,
halal, on the other hand, is associated with a double positive sign. Sales of the 486 products labeled as suitable for the Muslim diet grow in volume (+1.7%) and in value (+7.3%). Among the liveliest categories are durum wheat pasta and snack sweets.
Organic foods
Organic foods, obtained without synthetic pesticides and respecting animal welfare, are protagonists of unstoppable success abroad if made in Italy, but they experience a reduction in consumption in Italy, as reported by the recent Biobank report.
The worst performance concern fresh milk, jams and fruit-based spreads, while in value they also lose rice cakes and wholemeal/spelt/kamut/legume-based pasta.
The data from Osservatorio Immagino report that in supermarkets and hypermarkets the 8,272 products labeled as 'organic' lose -2.3% in value and -9.4% in volume. Prices also contribute to the trend. However, Cuppini highlights, 'perhaps the reasons come from further away (for example due to the strong competition that organic faces from certified or supply chain products, whose clientele is often positioned in higher income brackets)'.
The claim ‘supply chain’ appears on the labels of 2,124 products, which in 2022 increased turnover by +12.1%, close to 1.4 billion euros, and lost only -0.7% of volume sales. Excellent performance from some categories, such as UHT milk, semolina pasta, third processing beef, sugar, and chicken, while fresh milk declines in volume.
The landscape of beneficial ingredients
The products presented on labels as containing one of the 36 beneficial ingredients monitored by Osservatorio Immagino continue to generate growing turnover, +7.8% up to over 4 billion euros. Volume sales, however, slow down, ending 2022 at -4.7%.
The 13,145 references of this macro-basket are classified into 7 groups, with varying trends, almost always linked by declining sales, especially for spices and superfoods, increasingly expensive.
1 – Traditional
In the top three ingredients ‘Traditional‘ in importance, signs of greedflation:
– cocoa increases turnover by +10.2%, but loses in number of products sold (-2.4%). Especially for sweet spreads, seasonal eggs >30 grams, chocolate bars and tablets,
– hazelnut increases turnover by 15.3% but yields 7% of volumes, particularly for sweet spreads, followed by seasonal eggs and ice creams multipack,
– the lemon is mentioned on the label of 1,586 products, worth almost 528 million euros in revenue, +8.6%, but they lose almost one percentage point in volume sales, especially on ice cream multipack.
2 – Superfruit
The second basket by sales value in supermarkets and hypermarkets is that of Superfruit, which includes seven beneficial products/ingredients. In 2022, with 2,847 references, the turnover exceeded 809 million euros, +5.7%, but total volume sales decreased by -6.6%.
Almond, the claim main, present on 1,302 products, increases turnover by 5.3%, up to over 413 million euros, but loses -5.5% of volume sales. Very bad are breakfast cereals, shelled dried fruit and snacks.
Blueberry, second in importance, with over 213 million euros in turnover generated by 777 products, it represents a modest increase in value (+1.6%) and a sharp drop in volume sold (-8.7%). Greek strained skyr yogurt, whole yogurt and breakfast cereals were the most penalized categories by volume.
Coconut. The 424 products accompanied by this claim record a drop in quantities sold of over 14%, which price increases, however, translate into a 5.3% increase in turnover, up to over 107 million euros.
Contrary to the trend only two ingredients:
– theavocado maintains a performance brilliant, with an increase in volumes sold of 13.2%, equivalent to a higher volume in value of 29.4%,
– the mango, mentioned on the label of 241 products, drives volume sales (+1.2%) but especially value (+14.7%), up to almost 46 million euros.
3 – Cereals and flours
The 2,155 products which feature on the label at least one of the eight claim referring to as many cereals or pseudocereals represent a turnover in supermarkets and hypermarkets of over 551 million euros, +2.3% compared to 2021, but with sales volumes decreasing by -6.4%.
The claim most important in the basket is ‘oats’. It appears on 562 products, which in 2022 generated a turnover of over 268 million euros (+8%), but lost 3% of quantities sold. Wholegrain/multigrain biscuits, breakfast cereals and snacks performed poorly.
Farro, in second place, appears on 875 products, worth over 154 million euros. Sales decreased in value (-1.9%) and volume (-12.5%), especially for wholemeal/multigrain biscuits, snacks and cereals.
Only two claim among the cereals with performance positive on both sales sides are
– rice flour, present on 146 products, with a turnover of over 65 million euros (+12.4%) and quantities sold growing by +3.6% in volume. The highest volume sales concern the crackers, followed by traditional biscuits,
– corn flour, indicated on the label of 111 products generating a turnover of over 32 million euros, growing by +8.5% in value and +1% in volume.
The worst contraction in the group of cereals and flours concerns branded wheat kamut. The quantities sold for the 184 products labeled as containing this cereal plummet by -26.5%, while in value the decline is -21.7%, with a turnover of 29 million euros. In volume, the most penalized products were whole wheat/emmer/kamut/legume-based pasta, crunchy rolls, and sandwich bread.
4 – Sweeteners
Among the beneficial ingredients two sweeteners highlighted on the label of 523 products are also monitored:
– stevia, mentioned on 147 products, is a very trendy sweetener. Sales of products containing it grow both in volume (+7.5%) and in value (+10.9%), reaching nearly 42 million euros in turnover. Leading are the tea-based beverages, followed by sports nutrition products,
– cane sugar, comparable to beet sugar, is associated with a turnover of 127 million euros, stable with -0.2%, but marked by volume losses of -8.8%.
5 – Seeds
The Immagino Observatory monitors 5 claim related to the presence of as many seeds. Overall this basket counts 509 products worth 112 million euros, as usual with sales rising in value (+3.2%) and declining in volume (-4.5%).
The trend is positive only for the flax seeds, +8.1% in volume and +18.1% in value. All others are poor. Pumpkin seeds, the first in value, falls -4.1% in value and -8.1% in volume. Sesame seeds, -1% in value and -11.5% in volume. Less drastic the balance for the claim chia seeds, with sales at +7.2% in value and -0.3% in volume, especially for rolls and bi-compartmental yogurt. Strong annual decline, both in value (-15.4%) and volume (-17.5%) the claim ‘hemp’, identified on the labels of 52 products that have earned over 31 million euros.
6 – Spices
Negative trend also for the 901 accompanying products on pack from one of the three claim related to the world of spices. Overall, in 2022 sales volume decreased by -14.3% and revenue by -7.7%, reaching 87 million euros.
Ginger, present on 544 products, worth 59 million euros, with a sales decline of -5.7% in value and -10.7% in volume. Poor performance for other infusions, tea, chocolate bars and tablets.
Turmeric, present on 239 products, is sharply declining: -14% sales by value and -19.9% by volume. Other infusions, flavors and spices are contracting.
Cinnamon, present on the label of 180 products, loses almost 10% in value and a heavy -22.2% in volume. Ice creams especially lose market share multipack.
7 – Superfood
The attraction slows down for Superfood. Overall, the four claim monitored appear on the label of 154 products, which lose -12.6% in sales volume and -8.6% in turnover (over 12 million euros total).
‘Spirulina’ is the champion among Superfood in 2022. Present on 26 products, its claim managed to increase sales volume by +14.1% despite a strong price increase, which led to a +30.3% turnover, totaling 2.2 million euros. Driving growth were gluten-free pasta, smoothies/frappes, and fresh juices.
Relatively stable The trend of the claim ‘matcha‘, with +0.9% in value and -1% in volume compared to 2021. Smoothies/frappes and fresh juices grow, tea, ground coffee and sweet snacks decline.
The claim ‘açai’ loses share both in value (-9.2%) and volume (-11.9%), generating 2.7 million euros.
‘Goji’ suffers the worst result, -23.7% in value and -26% in volume, especially for dried, dehydrated and coated fruit and Uht juices.
I Superfood emerging
Besides the beneficial ingredients just commented on, Osservatorio Immagino has been monitoring since 2022 four others that embody emerging trends of interest:
Tahini sauce (or ‘tahina’) stands out for growth both in value (+34.7% over 2021) and in volume (+33.2%). Ethnic specialties, vegetable spreads and ready sauces categories increased, while sauces and pâtés declined.
The peanut butterdriven by a boom in supply (+67.8% compared to 2021), and despite a -22.9% drop in demand component, sold volumes increased by +30% and turnover by +44.9%. Among the 36 products that mention it on the label, sweet spreads and low-fat yogurt lead.
Edamame soy, recalled in 32 products, grew in value by +14.1%, but fell by -12.3% in volume, in particular for fish-based second courses.
The claim ‘royal jelly’ present on 45 products records -3.8% in sales value and -10.2% in volume. The most declining category is functional yogurt, followed by energy drink.
Processing method
The labels 3,756 products refer to the processing method, highlighting the craftsmanship of a particular production phase or the use of techniques that improve sensory or nutritional aspects.
During 2022 this basket achieved a value growth of +7.5%, mainly driven by price increases because the trend volume trend was negative at -5.2%.
The only claim 'not fried' escapes this trend, thanks to growth both in turnover (+12.1%) and quantities sold (+6.5%), particularly for extruded products, savory snacks, and crunchy bars.
Food texture: crunchy, creamy and soft
The texture (or consistency) of the food is highlighted with a claim in 7,213 products. In line with the general trend, despite a +6.1% value increase, sales lost -7.7% in volume. Growth is therefore mainly due to shelf price increases, which affected all 11 claim monitored.
Crunchy remains the claim main one both in number of products (1,668) and turnover (over one billion euros). The slight value growth (+0.7%) is accompanied by a sharp volume decline (-13.4%).
Creamy, second claim in importance, records +4.8% in value and -8.5% in quantities sold. Poor performance for yogurts and similar, baked goods and cereals, cheeses and hot beverage preparations.
Similar scenario for the claim ‘soft', recorded for 962 products: sales increase in value (+9%), decrease in volume (-2.6%).

Professional journalist since January 1995, she has worked for newspapers (Il Messaggero, Paese Sera, La Stampa) and magazines (NumeroUno, Il Salvagente). Author of investigative reports on food, she published the book 'Reading labels to know what we eat'.


